THIS IS A TEST AND IS NOT MEANT TO BE USED IN THE PLANNING OF OBSERVATIONS
RFI plots for C-band
C-band spectrum for HN in LL polarization
Data taken on 2024-05-07 21:30:00 UT
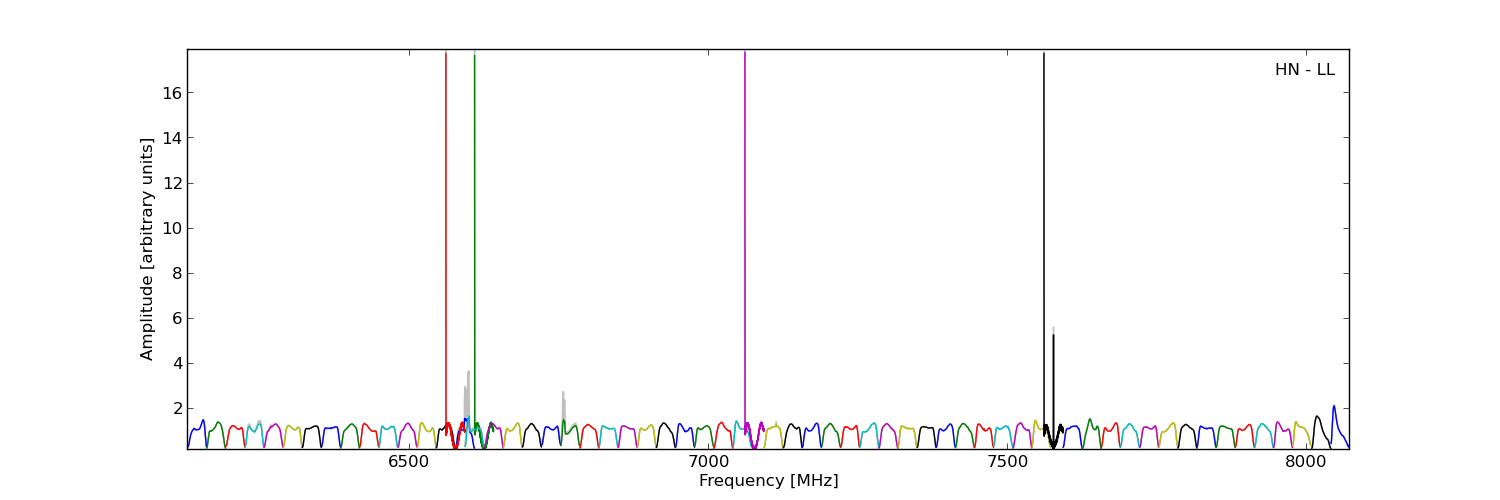
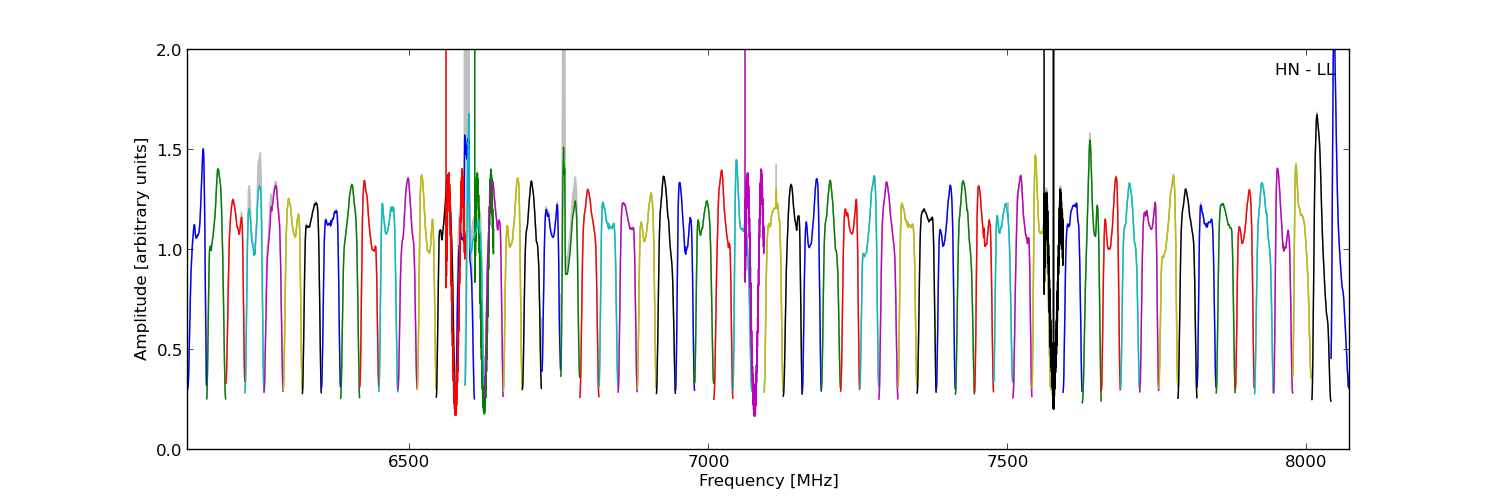
Total power spectrum in arbitrary units. The solid lines indicate the mean value and the shaded area the peaks.
Top figure is full scale and bottom figure zoomed for closer inspection.
Download all the data for this site from here, or explore the data interactively with the plots below
Zoomed spectra for interactive exploration
Left click and drag for zoom in the vertical and horizontal directions. Double click to reset.