Astronomy Observatory
Astronomy Observatory
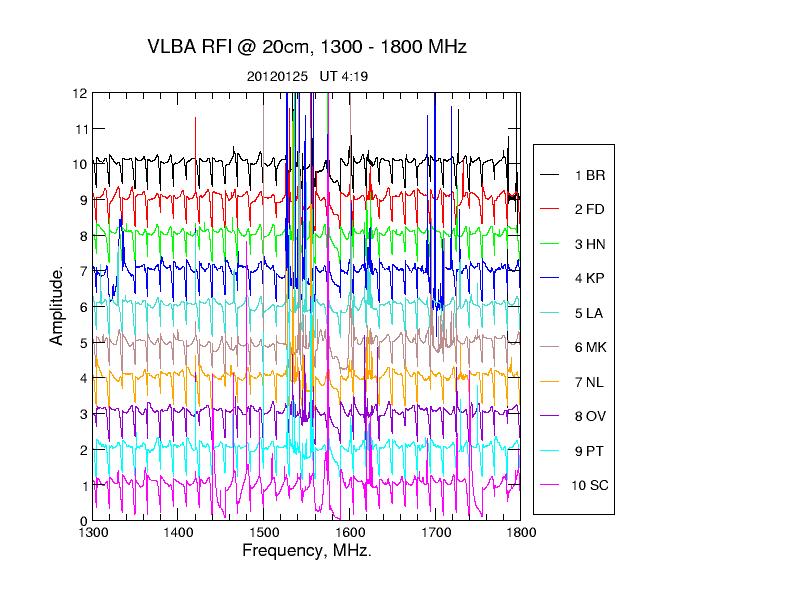
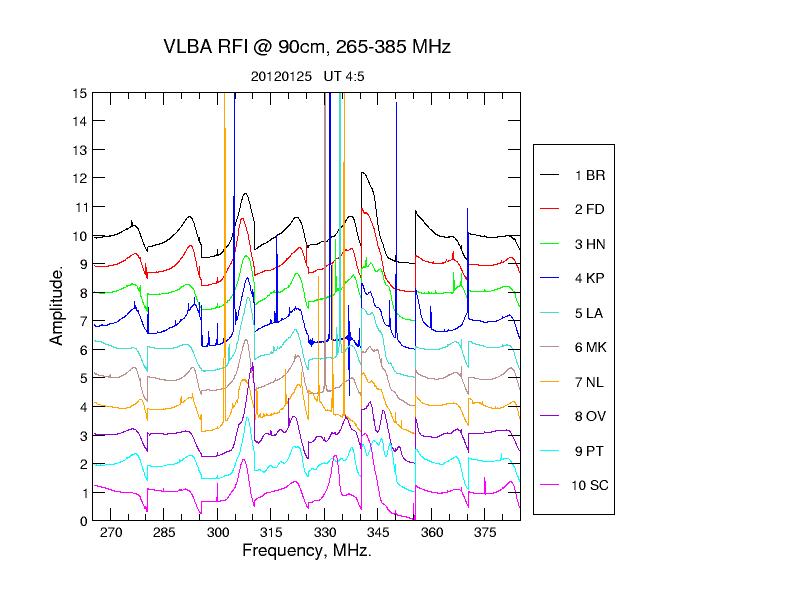
Radio Frequency Interference at the VLBAThis page is old! Please go to this new page.Radio Frequency Interference (RFI), both internally and externally generated, is an increasingly significant problem at VLBA sites, particularly at wavelengths of 18cm and longer. This page points you to information on known RFI at each VLBA antenna, current developments, and plans for handling the problem in the future. For each band surveyed, current and past postscript and giff interference plots show signal power vs. frequency. Overlay plots identify the known emitters in each band. If an error is displayed next to a link, that plot is currently unavailable.
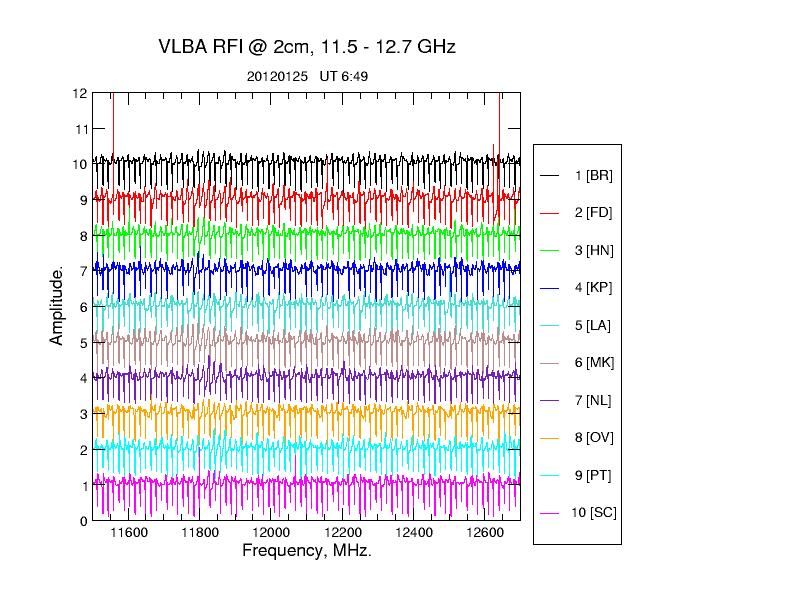
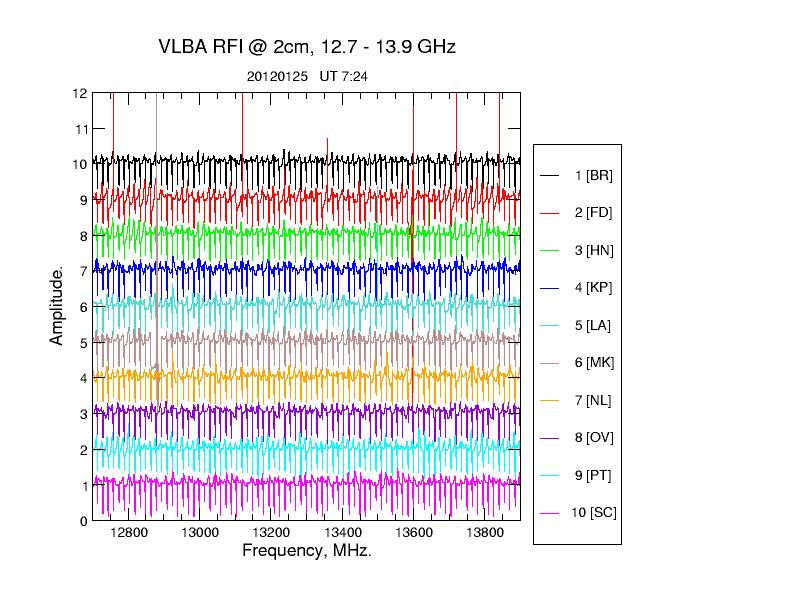
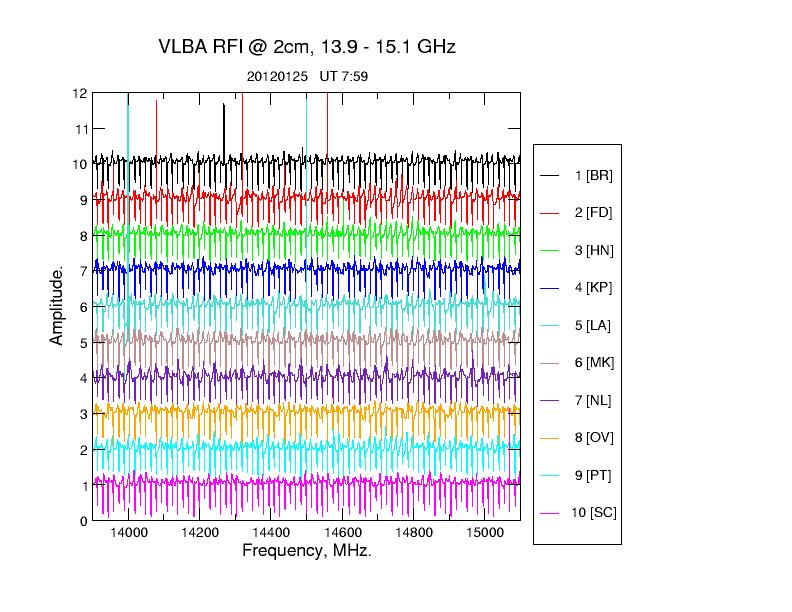
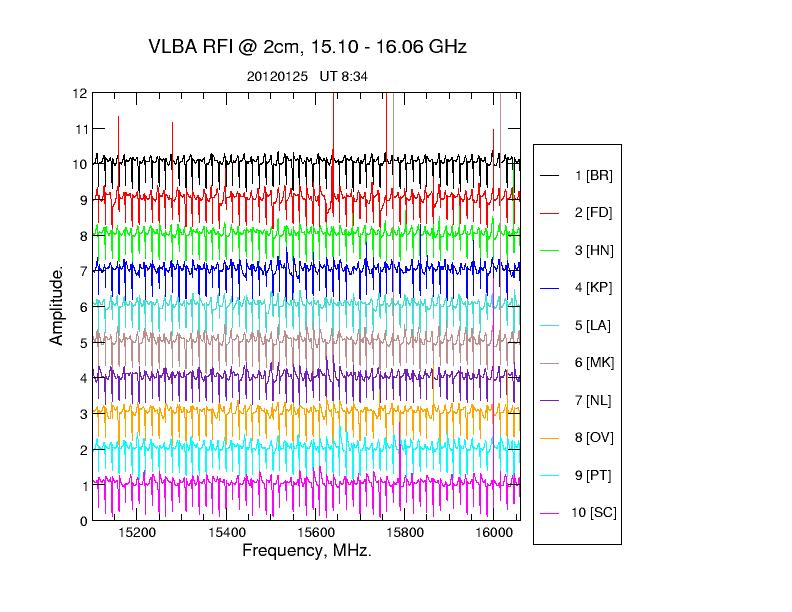
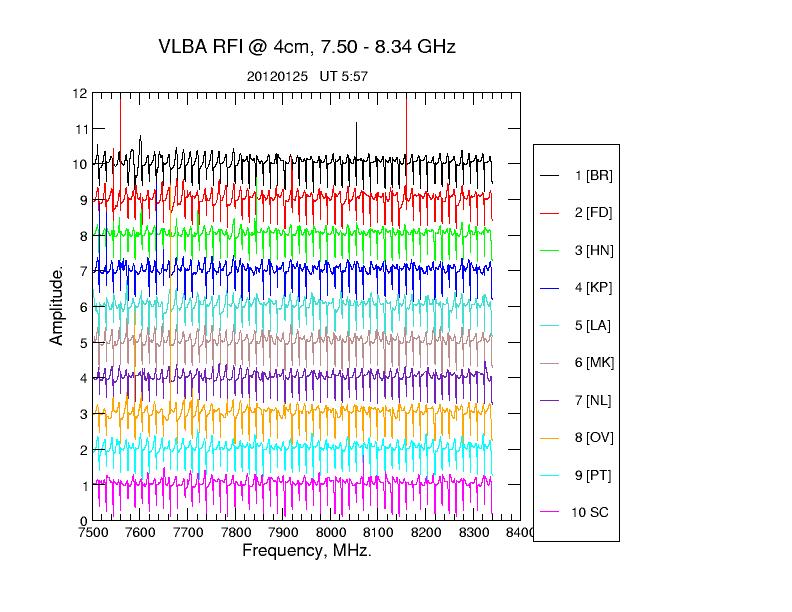
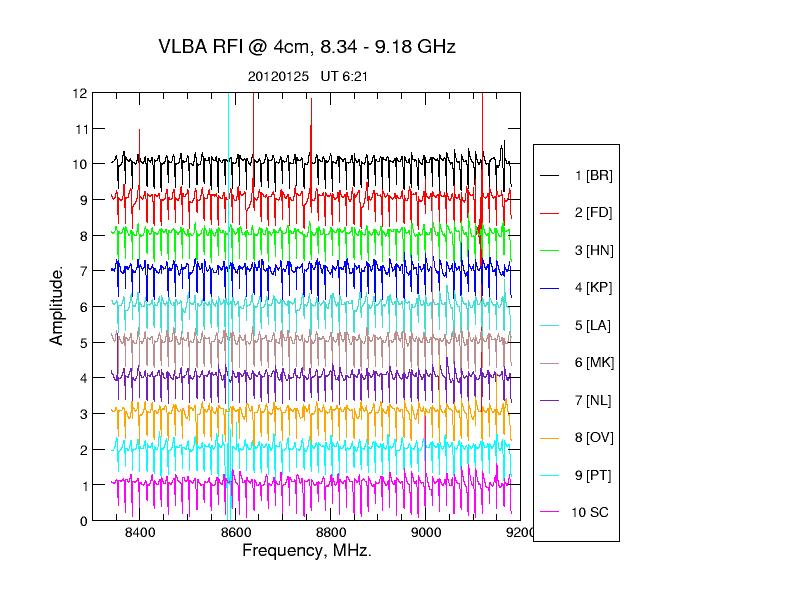
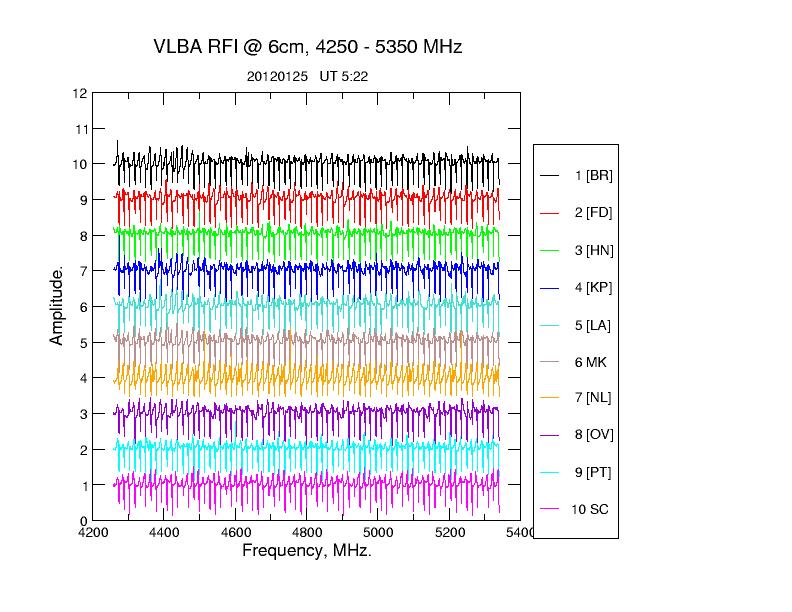
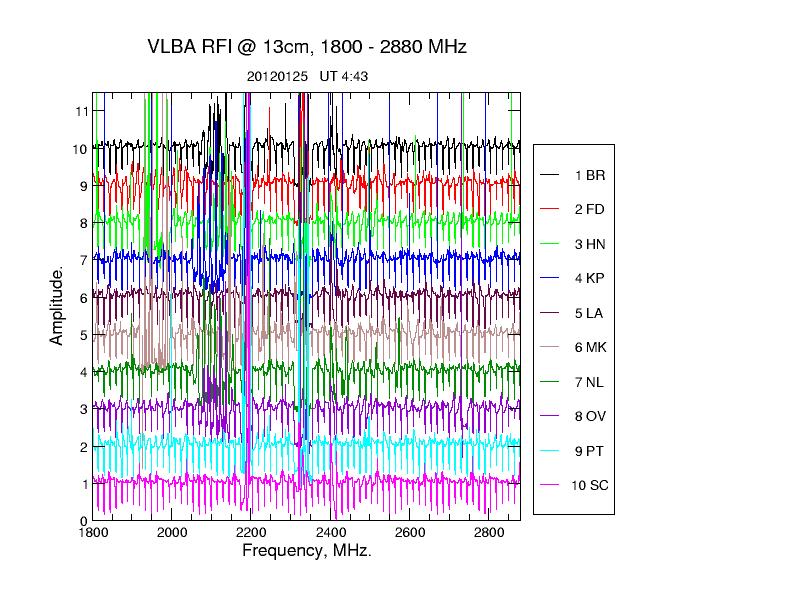
VLBA RFI Survey The plots included here were created from RFI surveying with all 10 VLBA antennae. Frequencies surveyed are P through U bands, and the data was reduced on the date shown on the plot. If a VLBA station was not available during the survey period then that particular site does not appear on the plot. Each plot is a series of spectral line observations stepped accross the entire band, thus a composite of a number of 16 MHz baseband autocorrelation spectra, overlapped by 0.5 MHz at each BBC end. The uneven noise level of the plots results from the VLBA baseband converter filter roll-off. The frequency resolution of the data is ~ 60 KHz. Since the survey ranges beyond the normal frequency limits of each band, those bands which have band-limiting filters will show reduced power levels at band extremities. The amplitude scale is in normalized units of Tsys for each 16MHz baseband auto correlation spectra; i.e. in the absence of RFI, each 16MHz BBC output has a baseline floor equal to Tsys. With strong RFI present the surrounding baseline is supressed such that the integral of the 16MHz BBC chunk is normalized; for example, a spike standing twice as high as the bandpass has a magnitude equal to about 2 * Tsys. HOW TO READ THE PLOTS On the right side of each plot is a numerical list of VLBA stations, usually in order 1-10 running from the top of the plot to the bottom; the spectra corresponding to each VLBA station is also in descending order from the top of the plot to the bottom. Thus the uppermost spectra corresponds to the first VLBA station listed. If you have access to the network at the AOC, the xmgr files from which these plots are created are available at /home/vlbiobs/VLBA_rfi/YYYYMMDD/band.xvgr, where YYYYMMDD is the date of the observation, and /band is the frequency band of interest. Using the xmgr files, one may zoom in to focus on particular frequencies, deactivate stations, change the amplitude scale, etc. If you do not have access to the NRAO AOC network, then you may FTP download gzip versions of the xmgr data files for these plots; to do so FTP to ftp.aoc.nrao.edu, login as "anonymous," use your full email address for your password; once connected go to the subdirectory /pub/staff/rarmenda, then download and gunzip the files. Click here for help on xmgr. -Socorro IPG U-band (11.5-16.06GHz)
At Saint Coix an IF filter limits the L-band intermediate frequency from 665 MHz to 1000 MHz. Thus a VLBA sched file choice of the lower IF corresponds to a sky frequency pass of 1259-1435MHz. Choosing the higher IF correseponds to a sky frequency pass of 1400-1735MHz. For these RFI surveys, the lower IF was used for frequency 1191-1544 MHz, and the higher IF for 1559-1900 MHz. Phi-band (.545-.665GHz)

Copyright © 2009 Associated Universities, Inc. |